
How to use AI to group unstructured survey responses in spreadsheets

AI is good at sorting free-text answers into tags, and unsupervised it will quietly invent a fourth tag the moment two responses don’t fit. The fix is to define the tags up front, hand the model a strict allowlist, and require it to use ‘other’ rather than to invent. With those three controls in place, your pivot table reads from a clean categorical column instead of a creative one.
Why ungoverned AI tagging falls apart
The model wants to be helpful, and helpful means adding labels you didn’t ask for.
If you ask ‘tag each response’ with no list of allowed tags, the model picks tags that fit each row. Run that across 500 responses and you’ll have 80 unique tags, half of which are tiny variations: ‘pricing,’ ‘price,’ ‘too expensive,’ ‘cost issues.’ Your pivot table treats those as four different things, and any rollup is wrong. The model didn’t fail; it did exactly what you asked, which was to summarize each row independently. The fix is to stop asking that question and start asking a different one: which of these specific tags applies?
The logic flow for strict categorization
Here’s the full pipeline that keeps tags clean. Each step closes a door the model would otherwise wander through.
Figure 1. The pipeline that keeps tags clean RAW RESPONSE COLUMN │ ▼ [1] DEFINE THE TAG SET (your job, not the AI’s) Pick 4 to 8 tags that cover the responses you expect. Write a one-line definition for each, with one or two example responses that should land in that tag. │ ▼ [2] ADD ‘other’ AND ‘unclear’ AS REAL TAGS These are escape hatches. A response that doesn’t fit a real tag goes to ‘other’; an ambiguous one goes to ‘unclear’. Without these, the model invents a new tag. │ ▼ [3] PROMPT WITH THE ALLOWLIST + RULES Hand the model the tags, definitions, examples, and one hard rule: use ONLY these labels, no new ones. │ ▼ [4] BATCH CLASSIFY (small batches, JSON output) 20 to 50 rows per call. Output: { row_id, tag, confidence: low/med/high, second_choice } │ ▼ [5] AUDIT THE ‘other’ AND ‘unclear’ ROWS These are your signal that the tag set is wrong, not that the model is wrong. Either add a new real tag and re-run, or accept that some responses are genuinely miscellaneous. │ ▼ [6] LOCK AND PIVOT Paste the final tag column as values. Build the pivot table off the locked column. The categorical axis is now safe. |
Step 2 is the one people skip and regret. ‘Other’ and ‘unclear’ are not a failure mode; they’re the safety valve that prevents the model from inventing a 9th tag at row 247 and ruining your rollup.
Designing the tag set

The tags decide everything downstream.
Read 30 to 50 responses before you write a single tag. Look for the natural groupings, and resist the urge to make them too fine. A tag set of four well-defined buckets outperforms a set of fifteen overlapping ones, because the model can place every response cleanly. Each tag needs three things: a name, a one-line definition, and at least one example response that should land there. Names should be mutually exclusive in plain English. If you can’t write a one-sentence rule that separates ‘pricing’ from ‘value,’ merge them.
- Aim for 4 to 8 real tags, plus ‘other’ and ‘unclear’.
- Each tag gets a one-line definition that distinguishes it from every other.
- Each tag gets one or two example responses, copy-pasted from your actual data.
- If two tags overlap, merge them or add a tie-breaker rule.
- Don’t include a ‘general feedback’ tag. It’s a magnet that absorbs half the data.
The classifier prompt
This is the prompt that does the actual work. Note how much of it is fences rather than instructions.
The prompt that prevents tag drift Classify each survey response below using ONLY one of the tags in this allowlist. Do not invent new tags. Do not modify the tag names.
ALLOWED TAGS (use exactly these strings): pricing: feedback about cost, billing, plans eg. ‘too expensive’, ‘no monthly option’ features: asks for or comments on product capability eg. ‘wish it had Slack integration’ usability: comments on how easy it is to use eg. ‘menu is confusing’ support: feedback about help or response time eg. ‘took a week to hear back’ performance: speed, reliability, downtime eg. ‘crashes every Monday’ other: doesn’t fit any tag above unclear: too vague to classify, or asks a question
Output JSON ONLY, one object per row: { row_id, tag, confidence: low|med|high, second_choice }
Rules: – If two tags fit, pick the one most clearly stated; put the other in second_choice. – If nothing fits well, use ‘other’. Never invent. – If the response is too short or vague, use ‘unclear’.
Responses: “”” [batch of rows here, each with a row_id] “”” |
Three details make this hold. The allowlist is shown with definitions and examples, so the model has something concrete to match against. ‘Other’ and ‘unclear’ are explicit options, so the model has somewhere safe to land. And the JSON output forces a single tag per row instead of a hedged ‘pricing and features.’
Why few-shot examples beat pure definitions
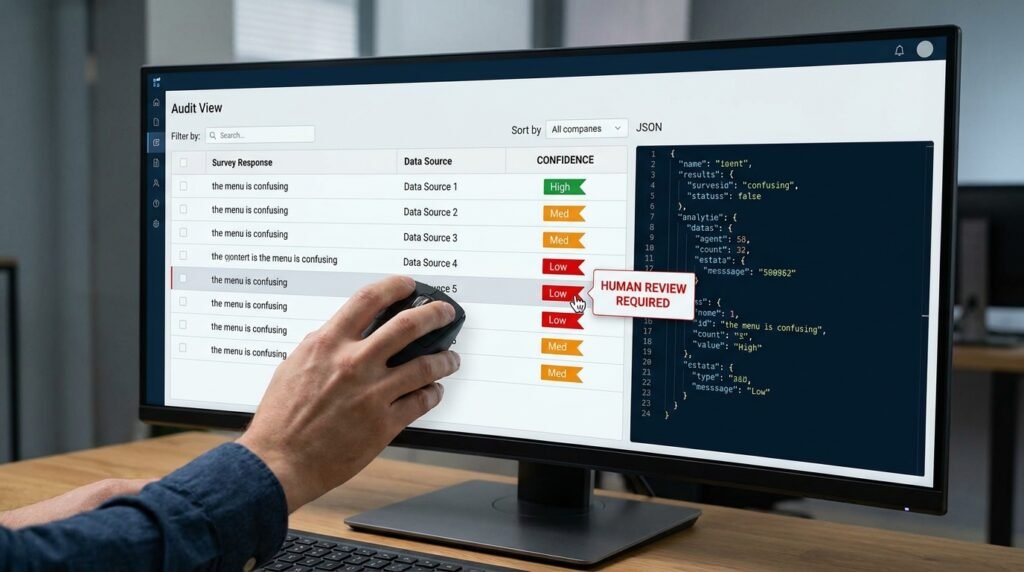
Two real responses per tag tell the model more than a paragraph of definition could.
A definition like ‘pricing: feedback about cost’ sounds clear and leaves wiggle room the model exploits. Add ‘too expensive’ and ‘no monthly option’ as concrete examples, and the model has anchor points to compare new responses against. The boundaries between tags become real instead of abstract, because the model can ask ‘is this more like the pricing example or more like the features example?’ rather than ‘does this match the words in the definition?’ Two examples per tag is enough. Past five, the examples themselves start to blur the boundary you were trying to sharpen.
Single-tag vs multi-tag, and the cost of mixing them
Pick one shape and commit.
Single-tag classification is faster, easier to pivot on, and forces a meaningful primary categorization for every row. Multi-tag is more accurate when responses genuinely combine concerns, like ‘too expensive and the menu is confusing,’ but it complicates everything downstream: your pivot table now has to count each row multiple times, and any percentage you report carries an asterisk. Pick before you start, and write the prompt to match. The trap is asking for single tags, getting some rows the model wanted to tag twice, and ending up with a column where ‘pricing+usability’ shows up as a tag of its own. That row is now in a third bucket and a fourth fight to clean up.
Batch sizes and what changes at scale
Don’t classify one row at a time, and don’t try the whole sheet in one call.
Per-row calls are expensive and slow. Whole-sheet calls hit context limits and tend to drift partway through, as the model loses track of the allowlist. The sweet spot is batches of 20 to 50 rows per call, with the tag allowlist repeated at the top of every batch. The allowlist costs you a few hundred tokens per call and pays for itself by keeping the tags consistent across batches. If you skip it on later batches because ‘the model already knows,’ you’ll see new tags appear by batch four.
The audit pass that earns its keep
After the run, three checks tell you whether the result is trustworthy.
- Count by tag. If one tag holds more than half your data, it’s too broad; split it. If a tag holds fewer than three rows, it might not deserve to exist.
- Read every ‘other’ and ‘unclear’ row by hand. If the same kind of response shows up repeatedly in ‘other,’ you missed a real tag; add it and re-run.
- Spot-check 20 random rows across the real tags. If you’d put them in a different tag than the model did, the definitions need sharper boundaries.
These three checks take fifteen minutes on a few hundred responses and catch most of the systematic errors that would otherwise show up in your pivot table as confident nonsense.
The tag-drift trap on long runs
Even with an allowlist, batches can drift.
If the model sees ‘pricing’ and ‘price’ both appear across earlier outputs (say, because an earlier prompt was looser), it starts treating them as interchangeable in later batches. The fix is two-fold: lock the tag spelling exactly in your prompt, never with a synonym, and after each batch, run a quick sanity check that every tag in the output appears in your allowlist. A tiny script or a simple spreadsheet formula catches stray spellings in seconds, well before they corrupt your final dataset.
Confidence scores and where to spend your review time
Asking the model to rate its own confidence is the cheapest review-targeting tool you have.
Have the prompt return low/med/high for each classification, and the audit reads itself. Every ‘low’ row gets a human look. A random sample of ‘med’ rows confirms the boundary is being applied consistently. The ‘high’ rows you mostly trust, and you spot-check them only on a small random sample. Without the confidence column, you’d either review everything (slow) or nothing (risky). With it, your time goes to the rows where the model itself signaled doubt, which is almost always where the real classification errors live. The score isn’t a measurement of truth; it’s a measurement of where the model felt least certain, and that’s exactly the signal you wanted.
When AI tagging is the wrong tool
Not every column needs a model.
If your responses are short and constrained, like a satisfaction column with ‘good,’ ‘okay,’ ‘bad’ as the typical answers, a regex or a few SUBSTITUTE formulas does the job faster, cheaper, and more predictably. AI earns its place when the answers are full sentences with genuine variety, where a person would have to read each one to classify it. The honest test: if you could write the categorization rules as a 20-line decision tree, do that instead. AI is for the cases where the decision tree would have 200 lines and still miss the long tail.
Questions people actually ask
Why did the model use a tag I didn’t define?
Three usual reasons: the allowlist was missing from the batch’s prompt, the prompt asked for a ‘summary’ or ‘category’ rather than for a tag from the list, or ‘other’ was missing as an explicit option. The model invents when there’s no safe home for a response. Add ‘other’ and the invention stops.
How many tags can the model handle reliably?
Up to roughly 10 to 12 with clear definitions, in my use. Past that, tags start to blur even for a human reviewer, and the model picks the wrong one more often. If you genuinely need 20 categories, classify in two passes: first into 5 broad parents, then into the subcategories within each parent.
Should I have the model justify its tag choice?
For audit batches, yes; for production runs, no. A justified output is easier to spot-check and twice as expensive. Run a small sample with justifications to validate the tag set, then turn justifications off for the full run.
What if a response should genuinely have two tags?
Decide before you start whether multi-tag is allowed. If yes, change the output to a list of tags per row and make the pivot logic count each tag separately. If no, keep one tag per row and use the ‘second_choice’ field for the next-best fit, which you can audit later. Both are valid; mixing them mid-run is the trap.
How do I track tag changes when the tag set evolves?
Version the tag set the way you’d version a small dataset. Keep a note of which run used which tag definitions, and re-tag from scratch when the set changes substantially rather than patching old results. Mixing tags from two versions in the same column is how a category quietly means two different things across rows, and your pivot loses meaning without telling you. A short version log next to the sheet is enough; the discipline is what matters.
Will the same prompt give different results on a re-run?
Slightly, yes. Models have small randomness by default. For categorization, set the temperature to zero or as low as your tool allows, so re-runs are stable. The few rows that change across runs are usually the genuinely ambiguous ones; flag those for human review.
Documenting the tag set so it survives a handoff
A tag column is only useful as long as someone remembers what each tag meant.
Write a short page that lives next to the data: each tag name, its one-line definition, two example responses, and a ‘this is not’ counter-example that lands in a different tag. Date the page. When a teammate inherits the analysis or you come back to it six months later, this is the document that lets the column be trusted. Skip it and even your own past tagging starts to look arbitrary, because the boundary decisions you made fluently in week one are invisible by month three. The doc is small. The cost of not having it is a re-tag from scratch.
Run a hundred-row pilot first
Before tagging your whole dataset, run the prompt on a hundred randomly selected rows. Read every ‘other’ and ‘unclear’ result. Adjust the tag set, lock the definitions, then run the full batch. Twenty minutes of pilot work prevents a day of cleanup, because the systematic errors that would otherwise spread across thousands of rows surface in the small sample where they’re cheap to fix.

Hi I’m Muzammil Haqani. I’m a content creator and AI expert with 3+ years of experience exploring and writing about artificial intelligence and technology. Through this blog, I share tutorials, insights, and practical guides to help readers understand and use AI tools effectively in their everyday lives.